
Use this template
Add your own experience and make this layout yours.
Resume Example
This resume format works exceptionally well for Applicant Tracking Systems (ATS) because it includes a clear professional summary that highlights key achievements and skills relevant to the data analytics field. The use of specific keywords like 'data visualization', 'financial analysis', and 'interactive dashboards' ensures high visibility in ATS searches. Additionally, the inclusion of quantifiable metrics (e.g., number of years experience, successful project outcomes) provides clear evidence of expertise that can easily be recognized by automated systems.
Instant Resume Score
Upload your resume for an instant ATS score and practical, role-specific improvements.
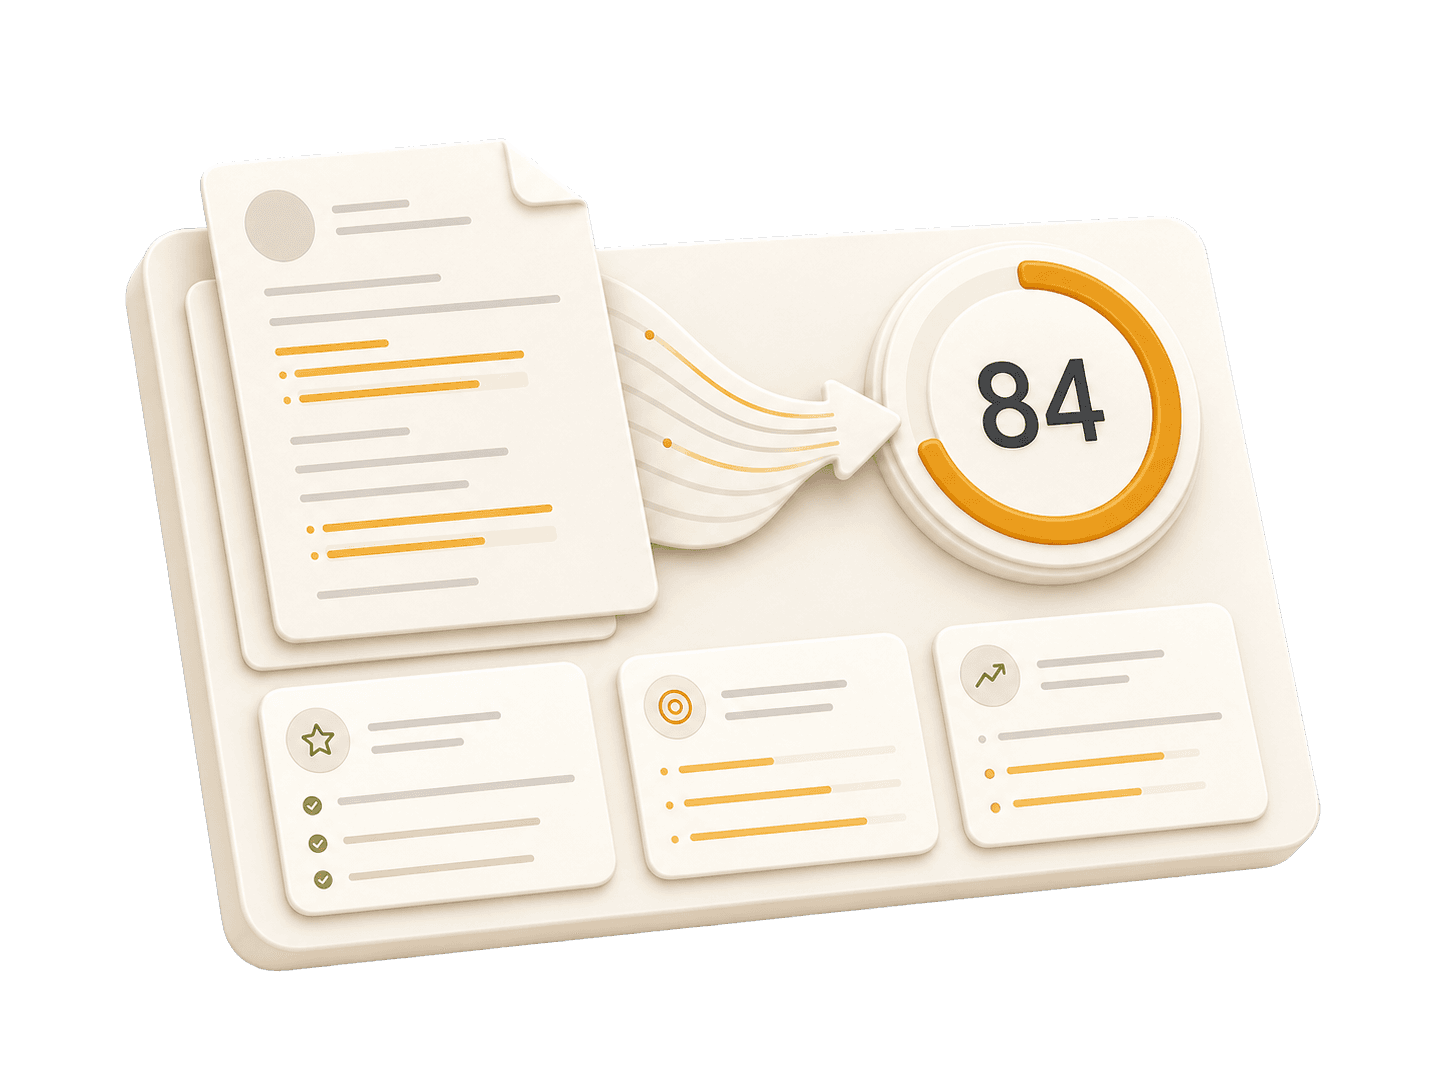
Add your resume to run a free score and get prioritized fixes.
Expert guidelines and best practices for each section of your resume.
01
First Name Last Name City, State, Zip Code Phone Number | Email Address LinkedIn Profile URL | Portfolio URL (Optional)
Your contact information is the first section recruiters see. Keep it concise and professional. Ensure your email address is appropriate (e.g., [email protected]). Include your LinkedIn profile for a comprehensive view of your professional journey. A portfolio or personal website is recommended for creative, technical, or design roles.
Do not include your full physical address (street number/name) for privacy reasons. Avoid including personal details like marital status, age, photo, or social security number unless specifically required in your country. Do NOT use unprofessional email addresses and do NOT include GitHub links for artists - use ArtStation, Behance, or portfolio sites instead.
John Doe 1234 Random St, Apt 56 New York, NY 10001 [email protected] github.com/aliciacode Single, 28 years old
Alicia Chen Los Angeles, CA (555) 123-4567 | [email protected] linkedin.com/in/aliciachen | artstation.com/aliciachen
02
Professional Title [Role Name] with [Number] years of experience in [Domain/Industry]. Highlight [Major Achievement] and the tools used to deliver it. Show how your work helped stakeholders make decisions, reduce manual reporting, or understand key metrics.
A professional summary is your elevator pitch. It should be 3-5 sentences long, summarizing your experience, key skills, and major achievements. Tailor it to the job description by using relevant keywords. Focus on what makes you unique and the value you bring to potential employers.
Avoid generic objectives like 'Looking for a challenging role to grow my skills.' Recruiters want to know what value you bring to them, not what you want from them. Don't use first-person pronouns (I, me, my). Keep it concise and impactful.
Compare a weak objective with a strong professional summary.
Objective: I am a hard-working individual looking for a Data Visualization position where I can learn new things and advance my career.
Senior Data Visualization Specialist with 7 years of experience turning complex business data into clear dashboards and decision-ready stories. Reduced reporting load times by 20% and helped teams monitor KPIs through Tableau, Power BI, D3.js, and Python workflows.
03
Technical Skills - Languages: [List] - Frameworks: [List] - Tools: [List] Soft Skills - [Skill 1], [Skill 2], [Skill 3]
Group your skills logically (e.g., Languages, Frameworks, Tools). Focus on hard skills relevant to the job. List skills in order of proficiency or relevance. Soft skills are better demonstrated through bullet points in your experience section rather than a bare list.
Do not list skills you are not comfortable using in an interview. Avoid using progress bars or percentages to rate your skills (e.g., "Java: 80%"). Don't include outdated technologies unless specifically required.
JavaScript: Intermediate, D3.js: Beginner
JavaScript, D3.js
I am proficient in Tableau and have intermediate skills in PowerBI
Tableau (Advanced), PowerBI (Intermediate)
04
Job Title | Company Name | Location Month Year – Month Year - Action Verb + Context + Result (Quantified) - Led [Project] resulting in [Outcome]... - Collaborated with [Team] to implement [Feature]...
This is the core of your resume. Use reverse-chronological order (most recent first). Start each bullet with a strong action verb. Focus on achievements and impact, not just duties. Use numbers to quantify your impact (dollars, percentages, time saved, users affected). Show progression and increasing responsibility.
Avoid passive language like "Responsible for..." or "Tasked with...." Don't list every single daily task; focus on significant contributions and measurable outcomes. Avoid jargon that recruiters outside your field won't understand.
Practical example showing do's and don'ts for experiences
Managed data visualization projects.
Designed 12 Tableau dashboards for finance and operations teams, reducing recurring manual reporting by 8 hours per month.
Created charts and graphs using Tableau.
Improved Power BI model performance by refactoring queries and measures, cutting average dashboard load time by 20%.
05
Degree Name | University Name | Location Month Year – Month Year - Relevant Coursework: [Course 1], [Course 2] - Honors/Awards: [Award Name] - GPA: X.X (if above 3.5)
List your highest degree first. If you have significant work experience, keep the education section brief. Include your GPA only if it is above 3.5 or if you are a recent graduate. Highlight relevant coursework, academic projects, honors, or leadership roles.
Do not include high school details if you have a college degree. Avoid listing every single course you took; select only the most relevant ones. Don't include graduation dates from decades ago if age discrimination is a concern in your field.
Practical example showing do's and don'ts for educations
Bachelor of Science | University of XYZ | Los Angeles, CA January 2013 – May 2017 - Coursework: Calculus I, English Literature, Marketing Principles - GPA: 3.4 (not worth mentioning)
Bachelor's Degree in Computer Science | University of California, Berkeley | Berkeley, CA September 2013 – May 2017 - Relevant Coursework: Data Structures and Algorithms, Database Systems, Information Visualization - Honors/Awards: Dean’s List (Fall 2014) - GPA: 3.8
06
Project Name | Tools/Technologies Used - Briefly describe what you created and its purpose - Highlight specific challenges you solved - Link to portfolio or demo if available
Projects are excellent for demonstrating practical skills, especially if you lack work experience or are changing careers. Include a link to your portfolio or demo if possible. Focus on projects that show problem-solving skills and relevant tools for the target role.
Don't include trivial tutorials unless you significantly expanded on them. Avoid projects that are outdated, incomplete, or irrelevant to the role you're applying for. Don't just list technologies—explain what you created and why it matters.
Practical example showing do's and don'ts for projects
Developed a simple pie chart using Tableau - no added value or context provided.
Created an interactive sales performance dashboard in Tableau that highlighted regional trends, seasonality, and forecast risks for quarterly planning.
Built a basic website with static content and no interactivity using HTML/CSS
Built a D3.js and Python traffic analytics dashboard with live usage views, helping product teams spot performance issues faster.
Common questions about this role and how to best present it on your resume.
Emphasize dashboard design, stakeholder collaboration, data storytelling, BI tools, and measurable improvements such as faster reporting, clearer KPI tracking, or reduced manual analysis.
Use results you can reasonably support, such as dashboard adoption, reporting time saved, load-time improvements, or the number of teams using your work. Avoid inflated claims that you cannot explain in an interview.
Include the tools you can use confidently, such as Tableau, Power BI, D3.js, Python, SQL, Excel, or cloud data platforms. Prioritize tools named in the job description when they match your experience.
Link to a portfolio that shows finished dashboards, explains the business question, describes your design choices, and notes any data cleaning or modeling work behind the visual.
Join thousands who transformed their careers with AI-powered resumes that pass ATS and impress hiring managers.
The average job seeker spends 3+ hours formatting a resume. Our AI does it in under 15 minutes, getting you to the application phase 12x faster.